Estimating Emissions from Sources of Air Pollution
6.1 Development of an Emissions Inventory
6.1.6 Emission Inventory Database Systems
As noted earlier in this section, the various regulatory and industrial groups who want or need the emissions information have developed their own emission inventory systems independently with little standardization. There are cases, however, within a single state in the United States and Europe, where the emissions inventory formats are standardized. The United States EPA requires certain emissions data to be submitted to the agency for a national emissions database. This data is, of course, standardized so there are specific requirements for how this data must be formatted. However, in most of these cases even where the data format has been standardized, less consideration has been given to how the data might be used in a full range of policy and regulatory analyses and is seen primarily as information for making very general trend analyses or for air quality modeling.
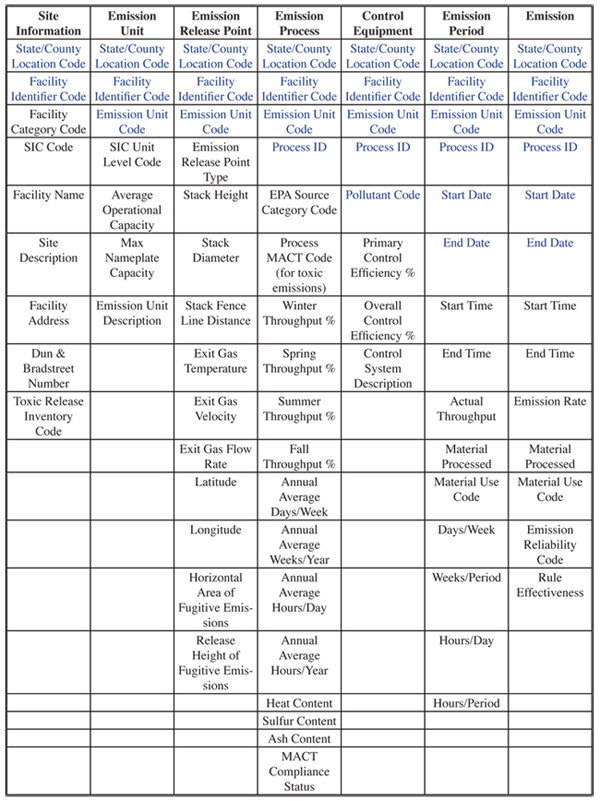
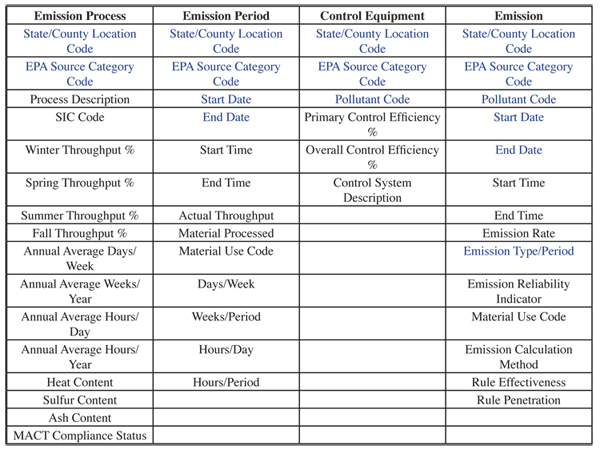
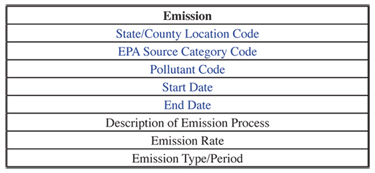
Discussions of the EPA emissions inventory database can be found at http://www.epa.gov/ttn/chief/eiinformation.html. Tables 6.1.6-1 through 6.1.6-4 outline the key variables included in the U.S. EPA emissions database for stationary sources, on-road mobile sources, area sources, and natural sources. It should be noted that the elements in blue in the tables indicate the information that the database uses as a key. A complete description of the input data can be found at the previously indicated EPA website. These tables are intended only to give a general outline of the data that is required in the U.S. national system. The U.S. EPA website should be consulted to retrieve specific details about the U.S. National emissions inventory format.
An emission inventory database is no better than the quality of the date that is placed into the database. Therefore, care must be taken to obtain the most accurate data possible for all sources. It is doubtful that any inventory database presently available can be trusted to be closer than 20% of the actual emissions; although, one might argue that random errors in an inventory could balance out to reduce this error. A quick bounding analysis of emissions data as illustrated in the table in the following section indicates where the most care must be taken to establish data accuracy to ensure the best overall estimation of the true inventory.
A review of the design of the U.S. EPA emissions inventory database indicates that the U.S. EPA database contains most of the information to support air quality modeling and trend analysis, and it does maintain some data that could be useful in policy and regulatory analysis.
The California Air Resources Board in the United States maintains an emissions inventory website. This can be found at http://www.arb.ca.gov/ei/ei.htm. This database contains a broad range of information related to emissions in California, and it is laid out well and is very user friendly. The database does not contain much information to support extended policy and regulatory analyses.
The European Convention on Long-Range Transboundary Air Pollution (LRTAP) has an ongoing effort to maintain an emissions inventory database for countries in Europe. The format of this database can be viewed at www.emep.int . The database is general in nature and appears to be oriented toward trend analysis and some limited policy evaluation of a large variety of emissions in Europe. The European Environmental Agency works with the LRTAP process and maintains a web site at http://dataservice.eea.europa.eu/dataservice/metadetails.asp?id=982 which contains information related to emissions information collected in Europe.
The information in table 6.1.6-1 outlines the key variables included in the U.S. EPA emissions database for stationary sources.
The entries in table 6.1.6-2 outline the key variables included in the U.S. EPA emissions database for on-road mobile sources.
The entries in table 6.1.6-3 outline the key variables included in the U.S. EPA emissions database for area sources.
The entries in table 6.1.6-4 outline the key variables included in the U.S. EPA emissions database for natural sources.
Discussions of the EPA emissions inventory database can be found at http://www.epa.gov/ttn/chief/eiinformation.html. Tables 6.1.6-1 through 6.1.6-4 outline the key variables included in the U.S. EPA emissions database for stationary sources, on-road mobile sources, area sources, and natural sources. It should be noted that the elements in blue in the tables indicate the information that the database uses as a key. A complete description of the input data can be found at the previously indicated EPA website. These tables are intended only to give a general outline of the data that is required in the U.S. national system. The U.S. EPA website should be consulted to retrieve specific details about the U.S. National emissions inventory format.
An emission inventory database is no better than the quality of the date that is placed into the database. Therefore, care must be taken to obtain the most accurate data possible for all sources. It is doubtful that any inventory database presently available can be trusted to be closer than 20% of the actual emissions; although, one might argue that random errors in an inventory could balance out to reduce this error. A quick bounding analysis of emissions data as illustrated in the table in the following section indicates where the most care must be taken to establish data accuracy to ensure the best overall estimation of the true inventory.
A review of the design of the U.S. EPA emissions inventory database indicates that the U.S. EPA database contains most of the information to support air quality modeling and trend analysis, and it does maintain some data that could be useful in policy and regulatory analysis.
The California Air Resources Board in the United States maintains an emissions inventory website. This can be found at http://www.arb.ca.gov/ei/ei.htm. This database contains a broad range of information related to emissions in California, and it is laid out well and is very user friendly. The database does not contain much information to support extended policy and regulatory analyses.
The European Convention on Long-Range Transboundary Air Pollution (LRTAP) has an ongoing effort to maintain an emissions inventory database for countries in Europe. The format of this database can be viewed at www.emep.int . The database is general in nature and appears to be oriented toward trend analysis and some limited policy evaluation of a large variety of emissions in Europe. The European Environmental Agency works with the LRTAP process and maintains a web site at http://dataservice.eea.europa.eu/dataservice/metadetails.asp?id=982 which contains information related to emissions information collected in Europe.
The information in table 6.1.6-1 outlines the key variables included in the U.S. EPA emissions database for stationary sources.
6.1.6-1 Key Elements of the U.S. EPA Emissions Database for Stationary Source Emissions
The entries in table 6.1.6-2 outline the key variables included in the U.S. EPA emissions database for on-road mobile sources.
The entries in table 6.1.6-3 outline the key variables included in the U.S. EPA emissions database for area sources.
The entries in table 6.1.6-4 outline the key variables included in the U.S. EPA emissions database for natural sources.


