Air Quality Modeling
7.6 Relevant Applications
7.6.3 Impacts of Global Climate Change and Emissions on Regional Ozone and Fine Particulate Matter Concentrations over the United States
Recent observations and future projections suggest that regional air quality will respond to global climate change and the two systems are intrinsically coupled [e.g., Intergovernmental Panel on Climate Change (IPCC), 2001; National Research Council (NRC), 2001; Brasseur and Roeckner, 2005]. Climate change over the next century is predicted to have a direct impact on meteorology [IPCC, 1996] and an indirect impact on emissions. The objective of this study is to assess the impacts of global climate change on regional air quality over the United States. Here, both the direct (impact of climate change on meteorology) and indirect impacts (those caused by emission changes due to either/both controls and climate change) are evaluated. We focus on O3 and fine particulate matter (FPM) because of their suspected significant human health effects. Future O3 and PM2.5 concentrations are compared to historic ones under two different cases: In the first case, impacts of changes on regional air quality in the United States by climate change alone are examined by keeping emissions sources, activity levels and controls constant. In the second case we estimate the future pollutant concentrations based on changes in climate and emissions using the IPCC A1B emission scenarios [IPCC,2000] and planned controls.
Air quality modeling was conducted using the Community Multiscale Air Quality (CMAQ) Modeling System [Binkowski and Roselle, 2003] and meteorology downscaled from the Goddard Institute of Space Studies (GISS) Global Climate Model (GCM) [Rind et al., 1999] using the Penn State/NCAR Mesoscale Model (MM5) [Grell et al.,1994]. Future-year emissions forecast for North America are developed by forecasting activity growth and application of emission controls, as discussed below.
The 2001 Clean Air Interstate Rule (CAIR) emission inventory (EI) (http://www.epa.gov/cair/technical.html) is used as the U.S. emission inventory for the historic period (i.e., 2000–2002), as well as the basis for projected emissions up to 2020. For Canada, the Environment Canada (EC)’s 2000 inventory has been used for area and mobile sources (http://www.epa.gov/ttn/chief/net/canada.html). For point sources, the 2002 inventory that the New York State Department of Environmental Conservation compiled using National Pollution Release Inventory (NPRI) was scaled using EC’s state level summary. For Mexico, the U.S. EPA’s 1999 BRAVO inventory has been updated with the Mexico NEI (http://www.epa.gov/ttn/chief/net/mexico.html).
Projection of emissions is done in two steps: (1) For near future (2001–2020), the 2020 CAIR EI of the U.S. EPA is modified using Economic Growth Analysis System (EGAS) factors (http://www.epa.gov/ttn/ecas/egas5.html) and (2) for far future (2020–2050) projections are carried out on the basis of the Netherlands Environmental Assessment Agency’s IMAGE model (http://www.mnp.nl/image), which uses widely accepted scenarios (i.e., Intergovernmental Panel on Climate Change (IPCC) Special Report on Emissions Scenarios (SRES)) [IPCC, 2000]. The scenario SRES-A1B has been selected for the far future projection in order to be consistent with the climate/meteorological modeling used here. The SRES A1B scenario describes a future world of rapid economic growth and global population. Emissions peak in midcentury and decline thereafter because of rapid introduction of more efficient technologies, and balanced usage between fossil fuels and other energy sources.
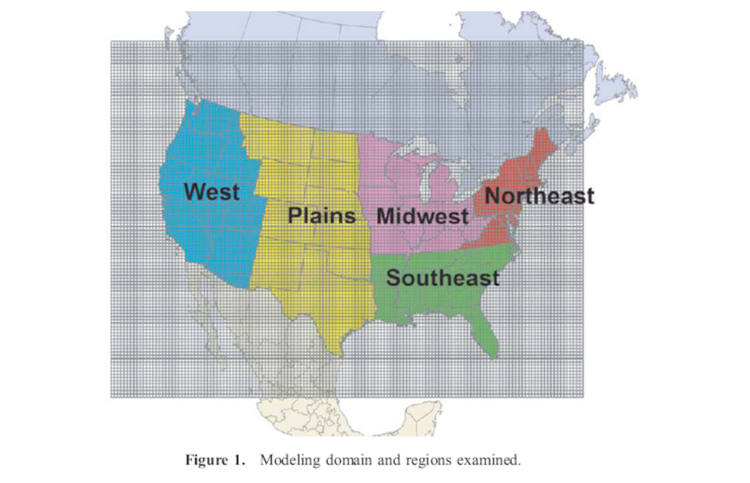
Meteorological fields are derived from the GISS GCM [Rind et al., 1999], which was applied at a horizontal resolution of 4º latitude by 5º longitude to simulate current and future climate at global scale [Mickley et al., 2004]. The simulation followed the SRES-A1B emission scenario [IPCC, 2000] for greenhouse gases. Leung and Gustafson [2005] downscaled the GISS simulations for 1995–2005 and 2045–2055 using the Penn State/NCAR Mesoscale Model (MM5) [Grell et al., 1994] to the regional scale. MM5 is applied in a nested configuration with 108 km horizontal resolution for the outer domain and 36 km for the inner one. The inner domain covers the continental United States, part of Canada, Mexico and ocean (figure 7.6.3-1).
Using meteorology simulated by MM5, both a full historic (2001) and future year (2050) as well as three summer (June-July-August) episodes for historic (2000–2002) and future (2049–2051) O3 and PM2.5 concentrations are simulated using the CMAQ Modeling System with the SAPRC 99 chemical mechanism.
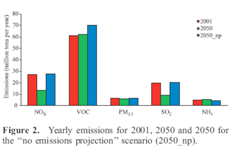 Emissions changes between future (2050) and historic(2001) years show large decreases in SO2 (-51%) and NOX (-51%) when climate change, growth in human activities and emission controls are simulated (2050 emission inventory and 2050 meteorology). For the case where only climatic changes are considered, VOC emissions are higher (+15%) in the future because of temperature effect on biogenic and mobile sources. Minor increases in NOX (+2%) and SO2 (+4%) are also predicted.
 Meteorological model performance is evaluated by comparing hourly statistical distributions of observed and predicted temperatures over the U.S. (figure 7.6.3-3) data from more than 1000 monitoring stations (see http://dss.ucar.edu/datasets/ds472.0/). A general underprediction is observed in all subregions but the model tends to over predict maximum temperatures. The 2050 annual average temperature is simulated to be 1.7K warmer than 2001 in the United States, with small variations by region (±0.5 K). Maximum warming occurs during fall with simulated average temperature changes up to 4.8 K in the west. The standard deviation calculated on the monthly average temperatures is higher for the annual simulation compared to summers in both observations and predictions.
 Global climate change, alone, has a small effect on future summer (i.e., 2049–2051) M8hO3 concentrations over the United States (figure 7.6.3-4) when compared to the historic summers (i.e., 2000–2002). The average regional changes range from -2.5% to +2.8%. The effect of climate change alone in summer PM2.5 concentrations seems to be quite important in the Midwest, southeast and Plains (7.6.3-4). Higher temperatures lead to increased gas phase partitioning of ammonium nitrate and organics. Sulfate, nitrate, ammonium and organic carbon decrease because of increased precipitation and higher temperatures (7.6.3-4) but no significant modification in PM2.5 composition is predicted.
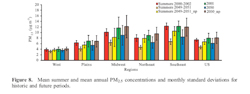 The impact of climate change, growth activity and emissions controls are more pronounced for the PM2.5 concentrations than M8hO3 (figure 7.6.3-5). The U.S. summer average concentrations for M8hO3 and PM2.5 are predicted to be lower by about 20% and 35%, respectively. Significant reduction is predicted for sulfate, nitrate and ammonium while a smaller reduction is predicted for organic carbon (7.6.3-5). Sulfate will be a significantly lower fraction of PM2.5 in the future; nitrate and ammonium will be slightly lower but organic carbon is predicted to be higher (7.6.3-5). Significant reduction is also estimated for the highest M8hO3 concentrations over all U.S. subregions along with the average concentrations (7.6.3-5). The Midwest is simulated to have the highest peak M8hO3 concentrations in the future as climate change alone has a more significant effect compared to the other U.S. subregions.
Regional O3 and PM2.5 concentrations for a future period (i.e., summers 2049–2051 and year 2050) are simulated to be lower compared to the historic period (i.e., summers 2000–2002 and year 2001), given the planned controls on precursor emissions, though global warming, alone, does lead to an increase in biogenic emissions. Climate change, alone, with no emissions growth or controls has a small effect on the M8hO3 and PM2.5 levels although changes in stagnation events, leading to higher pollutant concentrations over a slightly extended duration, may be regionally important. Future levels ofsulfate, nitrate and ammonium are simulated to be significantly lower compared to organic carbon, leaving organic carbon as the likely major constituent of fine particulate matter in the far future. M8hO3 concentrations over all domain subregions are simulated to be lower than the historic scenarios; both the number of days with M8hO3 concentrations above the standards and the peak concentrations are reduced for the urban areas.
The trend in pollutant concentrations reveals the key role that emission control strategies may play in future regional air quality, setting forecasting of emissions as key to being able to assess the impact of climate change on pollutant concentrations. One of the most important implications of this study is that the significant reduction predicted for sulfate, nitrate and ammonium concentrations will result in organic carbon as the most important PM2.5 component.
Air quality modeling was conducted using the Community Multiscale Air Quality (CMAQ) Modeling System [Binkowski and Roselle, 2003] and meteorology downscaled from the Goddard Institute of Space Studies (GISS) Global Climate Model (GCM) [Rind et al., 1999] using the Penn State/NCAR Mesoscale Model (MM5) [Grell et al.,1994]. Future-year emissions forecast for North America are developed by forecasting activity growth and application of emission controls, as discussed below.
The 2001 Clean Air Interstate Rule (CAIR) emission inventory (EI) (http://www.epa.gov/cair/technical.html) is used as the U.S. emission inventory for the historic period (i.e., 2000–2002), as well as the basis for projected emissions up to 2020. For Canada, the Environment Canada (EC)’s 2000 inventory has been used for area and mobile sources (http://www.epa.gov/ttn/chief/net/canada.html). For point sources, the 2002 inventory that the New York State Department of Environmental Conservation compiled using National Pollution Release Inventory (NPRI) was scaled using EC’s state level summary. For Mexico, the U.S. EPA’s 1999 BRAVO inventory has been updated with the Mexico NEI (http://www.epa.gov/ttn/chief/net/mexico.html).
Projection of emissions is done in two steps: (1) For near future (2001–2020), the 2020 CAIR EI of the U.S. EPA is modified using Economic Growth Analysis System (EGAS) factors (http://www.epa.gov/ttn/ecas/egas5.html) and (2) for far future (2020–2050) projections are carried out on the basis of the Netherlands Environmental Assessment Agency’s IMAGE model (http://www.mnp.nl/image), which uses widely accepted scenarios (i.e., Intergovernmental Panel on Climate Change (IPCC) Special Report on Emissions Scenarios (SRES)) [IPCC, 2000]. The scenario SRES-A1B has been selected for the far future projection in order to be consistent with the climate/meteorological modeling used here. The SRES A1B scenario describes a future world of rapid economic growth and global population. Emissions peak in midcentury and decline thereafter because of rapid introduction of more efficient technologies, and balanced usage between fossil fuels and other energy sources.
Meteorological fields are derived from the GISS GCM [Rind et al., 1999], which was applied at a horizontal resolution of 4º latitude by 5º longitude to simulate current and future climate at global scale [Mickley et al., 2004]. The simulation followed the SRES-A1B emission scenario [IPCC, 2000] for greenhouse gases. Leung and Gustafson [2005] downscaled the GISS simulations for 1995–2005 and 2045–2055 using the Penn State/NCAR Mesoscale Model (MM5) [Grell et al., 1994] to the regional scale. MM5 is applied in a nested configuration with 108 km horizontal resolution for the outer domain and 36 km for the inner one. The inner domain covers the continental United States, part of Canada, Mexico and ocean (figure 7.6.3-1).
Using meteorology simulated by MM5, both a full historic (2001) and future year (2050) as well as three summer (June-July-August) episodes for historic (2000–2002) and future (2049–2051) O3 and PM2.5 concentrations are simulated using the CMAQ Modeling System with the SAPRC 99 chemical mechanism.
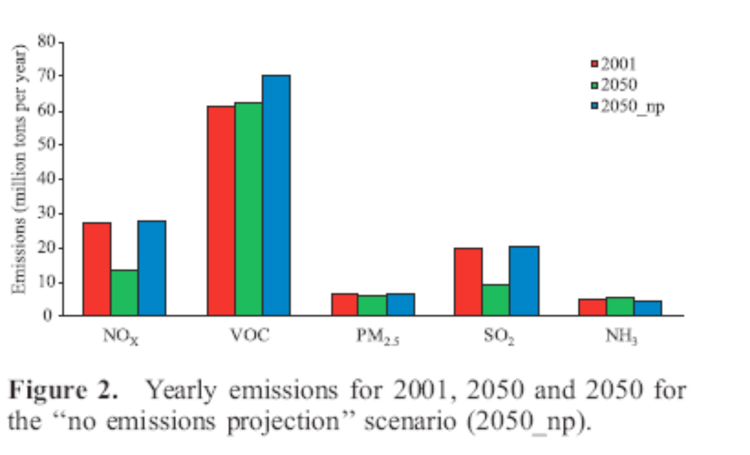
7.6.3-2 Yearly emissions for 2001, 2050, and 2050 for the “no emissions projection” scenario (2050_np)
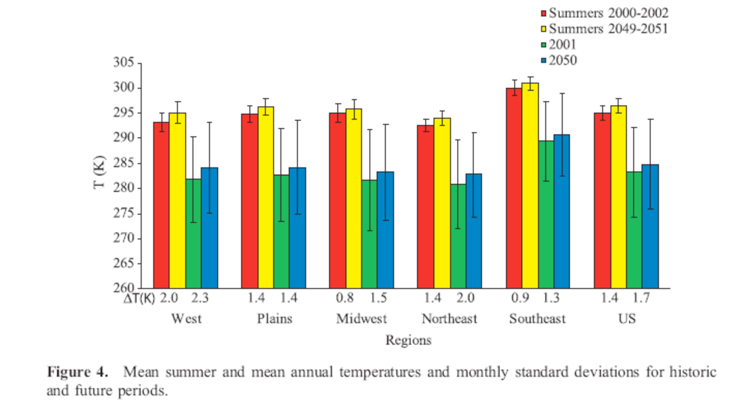
7.6.3-3 Mean summer and mean annual temperatures and monthly standard deviations for historic and future periods
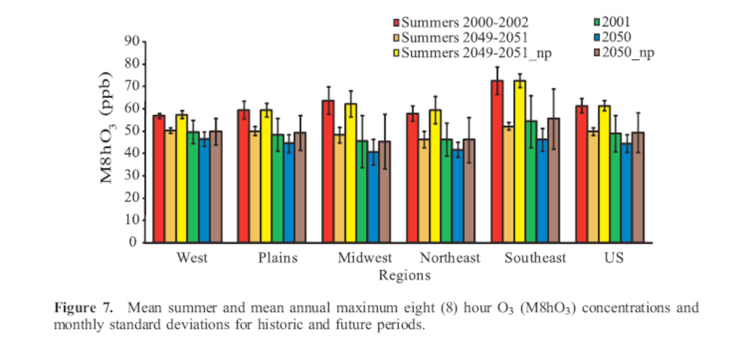
7.6.3-4 Mean summer and mean annual maximum eight (8) hour O3 (M8hO3) concentrations and monthly standard deviations for historic and future periods

7.6.3-5 Mean summer and mean annual PM2.5 concentrations and monthly standard deviations for historic and future periods
Regional O3 and PM2.5 concentrations for a future period (i.e., summers 2049–2051 and year 2050) are simulated to be lower compared to the historic period (i.e., summers 2000–2002 and year 2001), given the planned controls on precursor emissions, though global warming, alone, does lead to an increase in biogenic emissions. Climate change, alone, with no emissions growth or controls has a small effect on the M8hO3 and PM2.5 levels although changes in stagnation events, leading to higher pollutant concentrations over a slightly extended duration, may be regionally important. Future levels ofsulfate, nitrate and ammonium are simulated to be significantly lower compared to organic carbon, leaving organic carbon as the likely major constituent of fine particulate matter in the far future. M8hO3 concentrations over all domain subregions are simulated to be lower than the historic scenarios; both the number of days with M8hO3 concentrations above the standards and the peak concentrations are reduced for the urban areas.
The trend in pollutant concentrations reveals the key role that emission control strategies may play in future regional air quality, setting forecasting of emissions as key to being able to assess the impact of climate change on pollutant concentrations. One of the most important implications of this study is that the significant reduction predicted for sulfate, nitrate and ammonium concentrations will result in organic carbon as the most important PM2.5 component.