Estimating Emissions from Sources of Air Pollution
6.2 Estimating Emissions from On-Road Mobile Sources
6.2.8 Determination of Start-Up Patterns of On-Road Vehicles
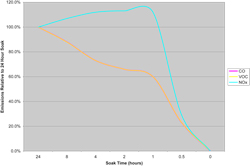
6.2.8-1 Impact of Soak Time on Start-Up Emissions for Fuel Injected Vehicle with 3-Way Catalyst
The emission curves for VOC and CO are the same. The curve for NOx is considerably different. This is due to the nature of the NOx catalyst in the vehicle and how it reacts to catalyst temperature. For the NOx catalyst there is an in-between soak time where more emissions occur due to the engine and catalyst being at an intermediate temperature.
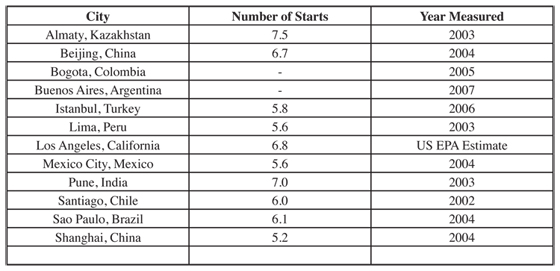
When questioned about how many vehicle starts that occur over the course of the day, most vehicle owners will indicate that they start their vehicle two to four times per day at most. Studies indicate otherwise. On the average, vehicle owners start their vehicles between 6 and 8 times per day. The soak times associated with these starts will vary from just a few minutes to more than 12 hours. The engine is typically the coldest for the morning start, but the starts that might occur at lunch and then to return home in the evening also include a relatively cool engine and catalyst. Other potential starts are to pick up passengers or to stop at the store or for refueling. Table 6.2.8-2 presents start data from cities studied by ISSRC.
6.2.8-2 Comparison of the Average Number of Starts per Day for Some Major Cities
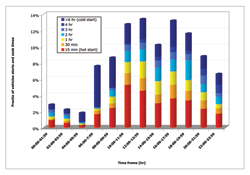
As noted earlier, the soak time before a vehicle start is an important indicator of the start-up emissions that will occur when the vehicle is started. Figure 6.2.8-3 shows the distribution of soak times for vehicle starts in Sao, Paulo Brazil.
As can be seen in figure 6.2.8-3, the highest fraction of soaks for greater than six hours occurs in the mornings. This is the expected result. There are, however, cold start-ups (> 6 hour soaks) that occur throughout the day. There are also many start-ups with only 15 minute or less soaks that occur during the day. In order to effectively estimate start-up emissions, it is important to understand the number of start-ups that occur in a day and the soak periods associated with those start-ups.
The simplest approach to collecting data on vehicle starts is to ask drivers to carry a notebook and to record the times when they start their engine and then stop their engine. This should be carried out for a one to two week period. The problem with this approach is that drivers often forget to note that they stopped their vehicle and turned the engine off. This leaves gaps in the data and leads to an underestimation of vehicle start-ups. If this approach is taken then care should be taken to make the drivers aware of the importance of the data and the need to be accurate.
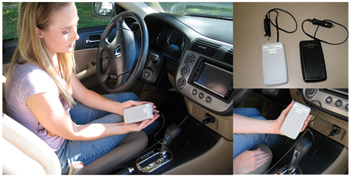
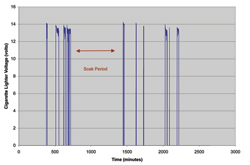
In order to avoid the errors associated with driver recorder start-up data, a vehicle can be outfitted with a device that records when the engine is running and when it is not. A sound recording device with a microphone in the engine compartment might work, but there would be some difficulty in automating data recovery. It is noteworthy that the alternator in a vehicle produces typically 13-14 volts when it is operating. The battery is typically between 11-12 volts when the engine is turned off. This difference in voltage can be used to determine if the vehicle is operating or not. Also, in many cases, the voltage to the cigarette lighter in a vehicle is turned off when the vehicle engine is not running. In this case, the voltage in the cigarette lighter will go from 0 to 13-14 volts when the vehicle is operating. This provides a large signal to determine if the vehicle engine is operating. ISSRC built such a device to measure the voltage in the cigarette lighter. This device records the time of day and the voltage in the lighter socket. This information can then be used to interpret if the engine is on or off. Figure 6.2.8-4 shows the device in use.
Seventy to eighty of these devices have been installed in vehicles for one week at a time to measure vehicle start-up patterns. Figure 6.2.8-5 shows the results from a unit installed in a vehicle where the voltage to the cigarette lighter is turned off when the engine is not running. The figure covers approximately a two-day period of time.
6.2.8-5 Illustration of Voltage Recorded in Cigarette Lighter Over 16 Hour Period
A final question with respect to the measurement of vehicle start-up patterns is how much data to collect. Of course, the more data the better, but it is too expensive and difficult to collect data from every person in a metropolitan area. Looking at the standard deviation of hourly start-up samples collected by ISSRC in eleven international cities, in order to keep the sample results within ±15% of the true hourly values and meet a 95% level of confidence, 160 randomly selected vehicle owners should be sampled. ISSRC has typically used 80 monitoring devices for one week per vehicle over a two week period to collect data on 160 vehicle owners. Due to measurement failures, this typically results in data from about 140 vehicle owners. It bears repeating that the more data that can be collected, the better.
It is also critical to ensure that the vehicle owners are representative of the vehicle population to be sampled. This latter constraint can be difficult because it is tempting to use vehicle owners that are easily accessible, which could bias the results.
