Estimating Emissions from Sources of Air Pollution
6.2 Estimating Emissions from On-Road Mobile Sources
6.2.3 Simplified Application of Emission Factors
Simple emissions factors, usually an amount of emissions per time or distance for a given source, multiplied by the length of time or distance of operation to achieve over all emissions, is the first approach taken by air quality managers to estimate emissions from various types of sources. This approach is straightforward and can provide a first order approximation of emissions. However, the user of this approach should understand that there is the potential for significant error in some cases. In the case of mobile sources, emission factors are typically written in terms of grams per kilometer or grams per mile of vehicle operation. In this case, the emissions from a vehicle can be estimated by multiplying the grams per kilometer emission factor by the kilometers or miles that the vehicle will be operated. In the case of a major city like Los Angeles, the number of kilometers can be 10,000,000 per hour for the total fleet.
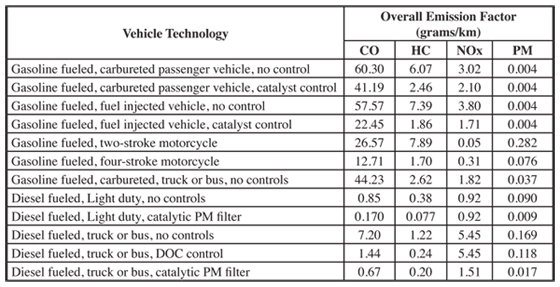
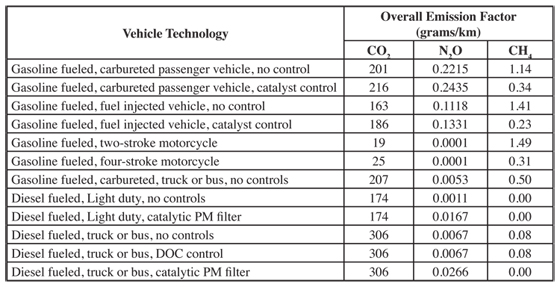
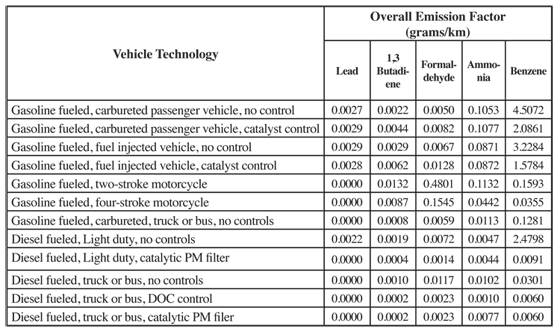
Emission factors are still considered a viable way of estimating emissions for many types of sources today. The USEPA maintains a web site where generic emission factors can be downloaded. These emission factors can be found at www.epa.gov/ttn/chief/ along with other relevant information. However, the USEPA no longer maintains these ‘simple’ emission factors for mobile sources since they tend to produce inaccurate results. The old USEPA emission factors can be found at http://www.epa.gov/otaq/ap42.htm#highway. Unfortunately, these emission factors are by model year, which makes them unusable for most applications outside of the United States. The reason for this is that the distribution of technologies within a given model year for the United States can be totally different from the distribution of technologies in another country for that same model year. Thus, it is best to avoid using these model year factors if at all possible unless they will be used for making calculations in the United States. The United Nations Environment Program (UNEP) has developed a toolkit based on emission factors that is helpful in making vehicle emission estimates in developing countries. The UNEP Toolkit can be found at www.unep.org/tnt-unep/toolkit. In order to make use of emission factors, the factors must, of course, represent the technologies that are available in the vehicle fleet of interest. Tables 6.2.3-1 to 6.2.3-2 present a set of emission factors that may reasonably reflect emissions from common technologies operating on the streets of developing countries. The emission factors shown in these tables are averages based on measurements by ISSRC in eleven cities around the world. These vehicle emission measurement studies and vehicle driving pattern studies were conducted in Almaty, Kazakhstan; Beijing, China; Los Angeles, USA; Mexico City, Mexico; Santiago, Chile; and Sao Paulo, Brazil.
The data in table 6.2.3-1 displays the emission factors for CO, HC, NOx, and PM.
The data in table 6.2.3-2 displays the emission factors for CO2, N2O, and CH4.
Finally, table 6.2.3-3 provides the emission factors for lead, 1,3, butadiene, formaldehyde, ammonia, and benzene.
It should be noted that the factors in tables 6.2.3-1 to 6.2.3-3 are calculated for vehicles that have an average use of 100,000 kilometers and are adjusted toward vehicle sizes typically found in the fleets of developing countries. The driving cycles used to develop the factors are consistent with those found as an overall average in the ISSRC studies around the world, and the fuels assumed correspond to those existing in most developing countries in 2007. Also, the start and evaporative emissions from the vehicles have been included in the calculations for the emission factors in the following tables. Thus, these emission factors do not allow the user to consider how aging can impact emissions, how vehicle size can impact emissions, how driving patterns can impact vehicle emissions, or how vehicle starts can impact emissions. On the other hand, they should allow the user a very rough approximation of emissions for a region until the user is prepared to use one of the more sophisticated models discussed in subsequent sections.
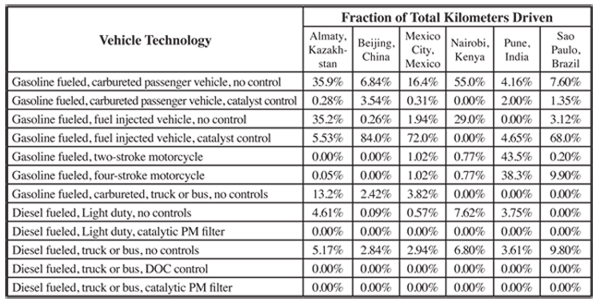
To make use of the factors in these tables, the user must take the emission rate values in the table and multiply them by the total number of kilometers driven by each vehicle type in the local fleet to estimate the overall vehicle fleet emissions. The determination of the total number of kilometers driven by each vehicle type in an urban or rural area is not a simple task and can involve a significant study itself. If the user is not aware of the breakdown of their fleet in terms of the fraction of vehicles in each technology class, then 6.2.3-4 can be used to estimate the fraction of vehicles in each technology class by selecting a city that is most like the city they are studying.
The user of 6.2.3-4 should understand that the vehicle technology distribution for Nairobi is influenced heavily by the fact that leaded fuel was used there at the time of the study and any catalysts on vehicles in Nairobi were considered inoperative.
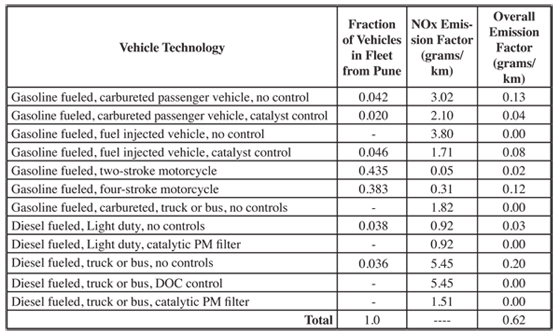
As an example, if it is intended to estimate the emissions for a city in Uganda, and specific fleet information is unknown, then the vehicle fleet distribution for Nairobi might be used with the emission factors in 6.2.3-1 to 6.2.3-3. However, in this special case, if leaded fuel is not used in Ugandan fuel, vehicles will have a working catalyst and the fleet distribution must be modified. This approach will produce an overall emissions factor for Uganda since the vehicle fleet in Uganda is likely to be similar to the vehicle fleet in Nairobi. The overall emissions factor can then be multiplied by the estimated total driving in the region of interest. If the total driving in the region of interest is unknown, it has been found that vehicles in developing countries drive an average of 42 kilometers per day per vehicle based on ISSRC studies, but this average driving rate fluctuates considerably from country to country. To illustrate the process, a crude NOx emission factor will be developed for the city of Mumbai, India assuming no prior information about Mumbai. In this case, the vehicle technology distribution from Pune, India will be used. The required information is presented in 6.2.3-5.
Obviously, the same emission factor would result for any city in India or the countries immediately surrounding India since fleet information is only available for Pune at this point in time. To complete the calculations and get overall emissions for Mumbai, some estimation of the number of kilometers driven in Mumbai must be made and multiplied by the emission factor derived in
The emission factor tables in this section do not contain emissions associated with brake or tire wear. Brakes and tires contribute some particulate emissions to the air. Unfortunately, the research on these emission sources is limited. The U.S. EPA carried out an evaluation of existing data in association with the development of the Moves model. The U.S. EPA concluded that the PM2.5 emissions associated with brake and tire wear is about 3 mg/kilometer and the PM10 emissions are about 23 mg/kilometer. (http://www.epa.gov/otaq/models/ngm/facabraketire.pdf) Hopefully research in the future will provide better emission estimates.
More accurate results can be achieved using the IVE model discussed in a later section, but the emission factor derived here can serve as a starting point for emissions estimates in a region.
