Developing a Framework for Effective Air Quality Management
3.5 Understanding the Sources of Air Quality Problems
3.5.2 Source Categories
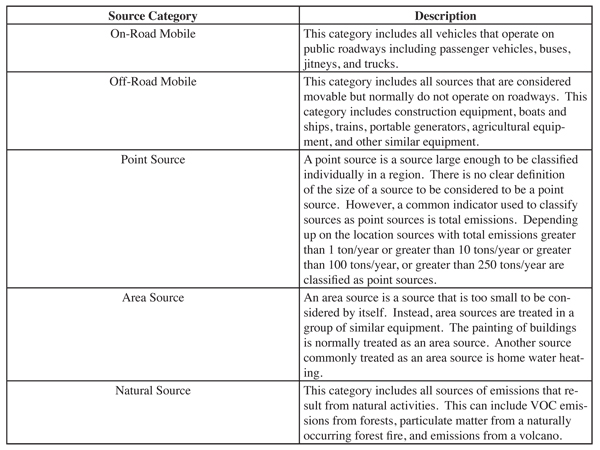
Sources are generally broken into five categories. These are shown in table 3.5.2-1 along with a description of the category.
The largest source of emissions in urban areas is normally on-road mobile sources. This is followed by point sources, area sources, off-road sources, and natural sources in most cases. Of course different areas can vary considerably in which category contributes the most emissions. Because off-road sources have historically received less regulation, they are becoming a more important source of emissions in many locations compared to on-road mobile, point, and area sources which may have been regulated more heavily. Los Angeles is an example of this situation. Table 3.5.2-2 below indicates the sources of the local air pollution problems in the Los Angeles metropolitan area for 2005 (source of the data is the California Air Resources Board, http://www.arb.ca.gov/ei/emissiondata.htm).
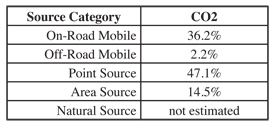
Table 3.5.2-3 indicates the relative contributions of the different sources of climate change pollutants in the State of California in the United States for 2005 (source of the data is the California Air Resources Board, http://www.arb.ca.gov/ei/emissiondata.htm). All gases (CO2, CH4, and N2O) were converted to equivalent CO2. The same categories were used as for local air pollutants.
The largest source of emissions in urban areas is normally on-road mobile sources. This is followed by point sources, area sources, off-road sources, and natural sources in most cases. Of course different areas can vary considerably in which category contributes the most emissions. Because off-road sources have historically received less regulation, they are becoming a more important source of emissions in many locations compared to on-road mobile, point, and area sources which may have been regulated more heavily. Los Angeles is an example of this situation. Table 3.5.2-2 below indicates the sources of the local air pollution problems in the Los Angeles metropolitan area for 2005 (source of the data is the California Air Resources Board, http://www.arb.ca.gov/ei/emissiondata.htm).
3.5.2-2 Sources of Local Air Pollution Problems in the South Coast Air Basin (Los Angeles) in the United States for 2005
Table 3.5.2-3 indicates the relative contributions of the different sources of climate change pollutants in the State of California in the United States for 2005 (source of the data is the California Air Resources Board, http://www.arb.ca.gov/ei/emissiondata.htm). All gases (CO2, CH4, and N2O) were converted to equivalent CO2. The same categories were used as for local air pollutants.
3.5.2-3 Sources of Climate Change Gases in the State of California, U.S.A. for 2004


